

How to calculate the operating cost of a liquid filling machine
Time : Oct 23, 2026
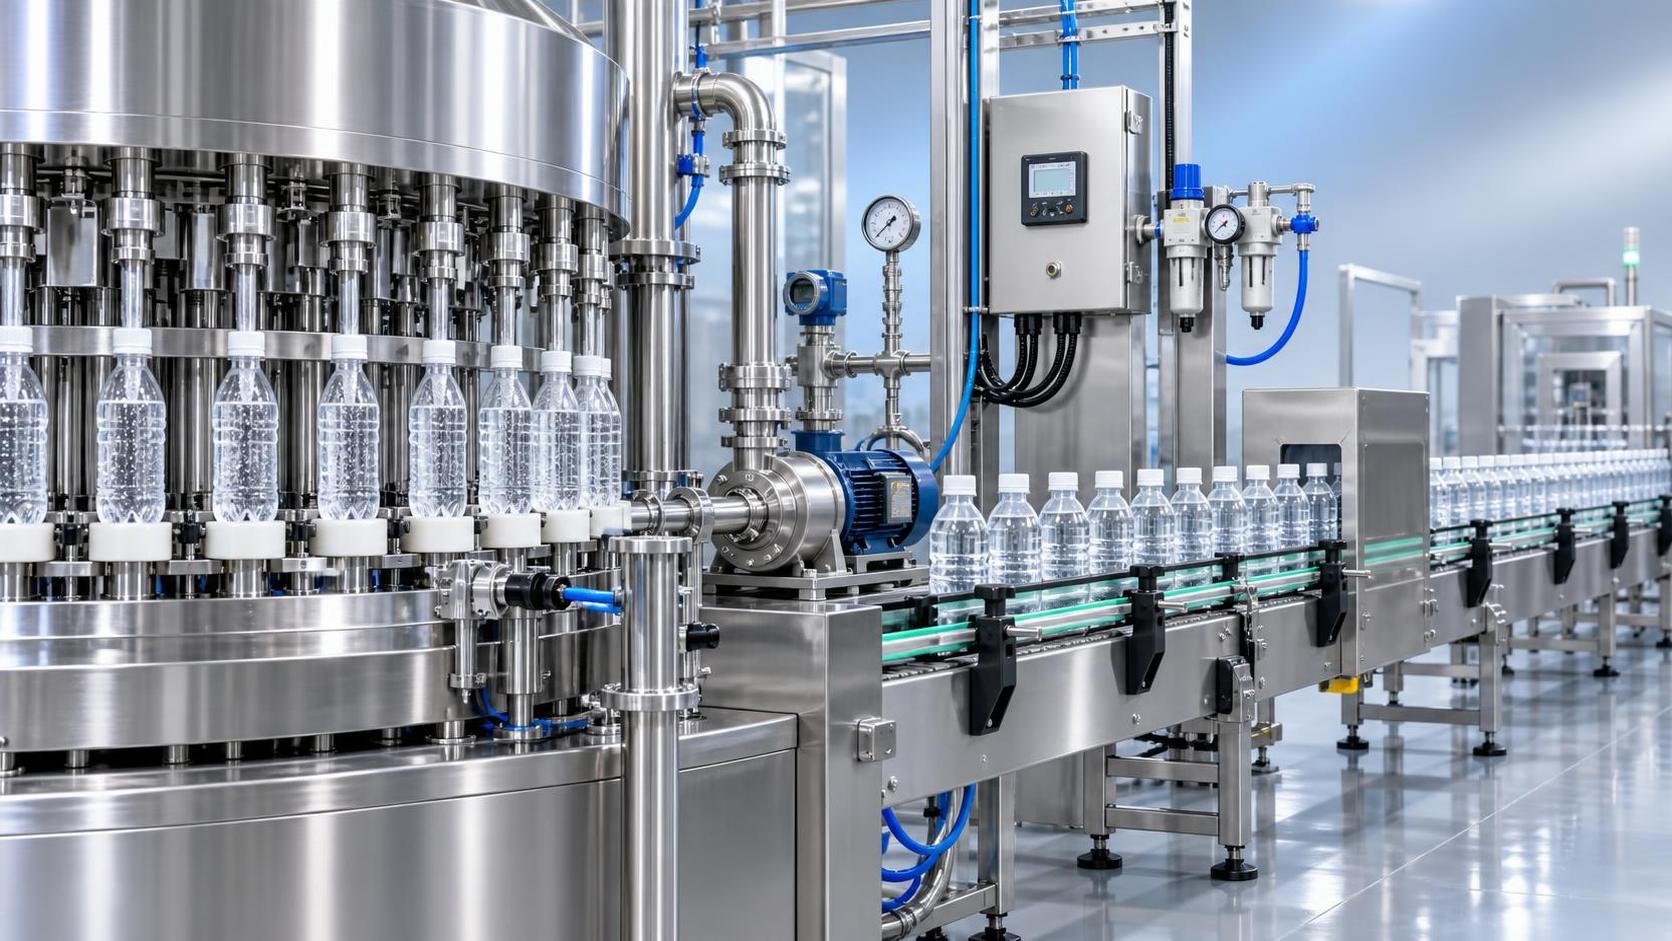
The operating cost of a Liquid Filling Machine should be calculated as a cost per saleable filled unit, not as a monthly utility estimate and not as a percentage of the machine purchase price. A useful calculation captures every expense required to keep the filler producing acceptable containers at the planned output: electricity, compressed air, labor assigned to the line, cleaning materials, maintenance parts, packaging losses, changeover time, and the value of lost production during stoppages.
Start with a defined production period, such as one shift, one week, or one month. Then divide the total relevant cost for that period by the number of containers that pass quality inspection and enter finished-goods inventory. Excluding rejected, underfilled, leaking, or damaged containers from the output denominator is important. A line that fills many bottles but releases fewer acceptable bottles has a higher true unit cost than its speed rating suggests.
Use a saleable-output cost model
The core calculation is:
Operating cost per saleable container = Total operating cost during the period / Saleable containers produced during the period
Total operating cost should include the following categories:
- Direct energy: electricity for the filler, product pump, conveyor sections, controls, heaters where applicable, and supporting equipment assigned to the filling area.
- Compressed air and utilities: air used by pneumatic cylinders, valves, reject devices, and container handling components; water and chemicals consumed during cleaning cycles should be recorded separately.
- Labor: paid line time associated with running, monitoring, cleaning, setting up, inspecting, and closing out the machine, including time spent resolving minor faults.
- Maintenance: planned service labor, replacement seals, filling valves, gaskets, filters, belts, bearings, lubricants, sensor components, and corrective repair costs.
- Production losses: product discarded during start-up, filling inaccuracies, container rejects, cap-related rejects, label damage, and material wasted during unstable running.
- Downtime cost: the contribution lost when the line is scheduled to run but cannot produce saleable units because of failures, blocked downstream equipment, cleaning overruns, or long changeovers.
Some organizations also include depreciation, insurance, floor space, financing, and supervisory overhead in a total cost of ownership model. Those costs are relevant to investment approval, but they should not obscure the machine-level operating calculation. Keeping the recurring running cost separate from capital recovery makes it easier to compare alternatives with different purchase prices, useful lives, and installation scopes.
Measure actual production time before applying nameplate speed
Rated speed is often expressed in containers per hour under defined conditions. It is not the same as saleable output over a shift. A machine rated for a high volume may spend substantial time waiting for empty bottles, clearing jams, replenishing caps, adjusting guide rails, cleaning fill nozzles, or running at a lower speed because the product foams or the container is unstable.
Use three time measures:
A practical output equation is:
Saleable containers = Effective production time × Average stable speed × First-pass quality rate
Average stable speed should come from production records rather than a catalog figure. First-pass quality rate should account for units rejected at filling and immediate downstream inspection. If product is recovered after rework, record the labor, material, and disruption separately instead of treating the unit as if it had passed on the first attempt.
Calculate energy from load and operating profile
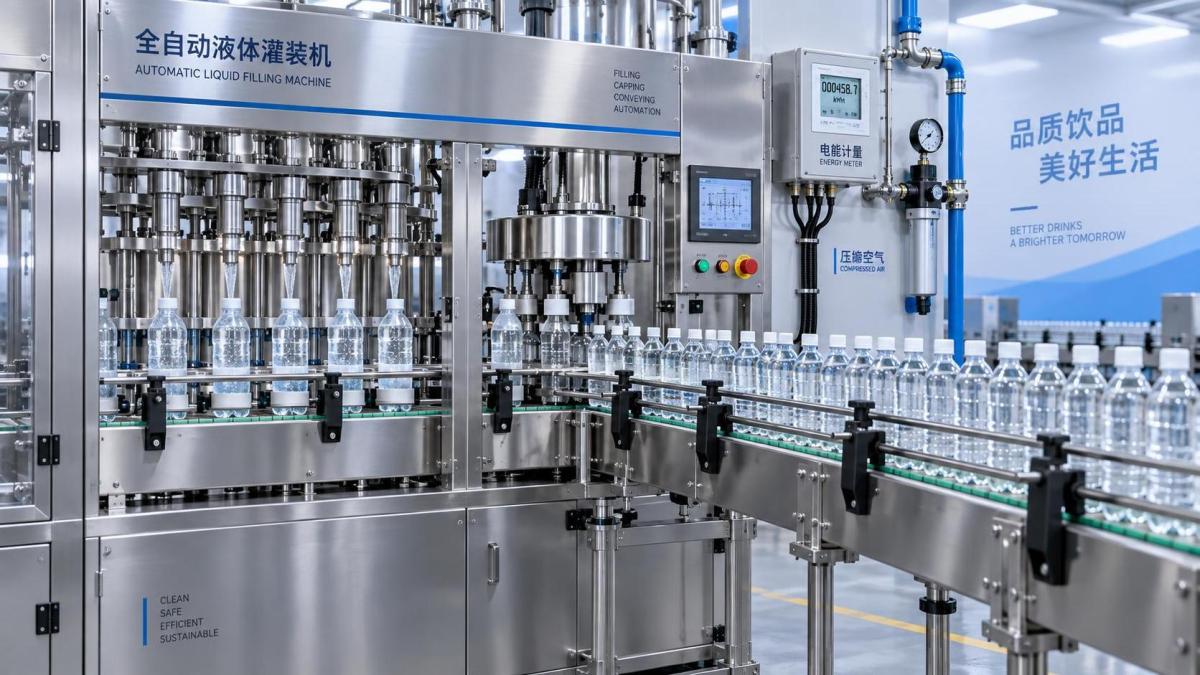
Energy is frequently understated because the calculation uses the motor nameplate rating multiplied by total shift hours. Motors do not necessarily operate at full load, and the filling system may consume power even while production is stopped. The more reliable approach uses metered consumption where available. If metering is not installed, estimate each relevant load using its typical operating power and the time it is energized.
Electricity cost = Measured or estimated kWh × electricity tariff
The boundary must be consistent. If the filler requires a product feed pump, bottle conveyor, capper interface, or local control cabinet to operate, those loads belong in the line calculation. A central chilled-water system or air compressor should be allocated using a documented basis, such as metered branch usage, equipment air demand, or a reasonable share of operating time.
Compressed air deserves separate attention. Air leaks, excessive pressure settings, and repeated pneumatic movements during stops can create a utility cost that is invisible at the filler panel. A pneumatic filling arrangement also has a different cost profile from a servo-driven or gravity system. The comparison should use the actual application: bottle size, product viscosity, filling method, required sanitation cycle, and planned operating hours.
Labor cost includes the time around the fill cycle
Labor should be based on paid time assigned to the line, not merely the minutes when bottles are moving. A filling operation requires preparation, product transfer coordination, container and closure replenishment, quality sampling, cleaning, format adjustment, and documentation. When several machines share personnel, allocate labor according to observed time or a stable production rule, rather than assigning the full cost to every machine.
Labor cost per saleable container = Total line labor cost for the period / Saleable containers for the period
Changeovers often create a misleading result. A short mechanical adjustment may still require line clearance, replacement of change parts, product recovery, cleaning, fill-volume verification, and a period of low-speed stabilization. A line producing many SKUs in small batches can therefore have a higher labor and downtime cost per bottle than a slower line dedicated to one format for a long run.
Record changeover duration by product and package family. A switch between two similar bottle diameters is not equivalent to a move from a still beverage in PET to a more viscous product in another container format. Treating all format changes as identical makes a projected annual cost unreliable.
Maintenance must include consumables and production interruption
Maintenance cost is not limited to invoices for major repairs. In a liquid filling machine, recurring items may include nozzle seals, valve seats, O-rings, diaphragms, product-contact hoses, filters, pump seals, conveyor wear parts, and sensors exposed to moisture or cleaning chemicals. The cost of a spare part should be paired with the labor required to replace it and the production time lost while access, sanitation, testing, and restart are completed.
Separate planned maintenance from corrective failures. Planned work can often be scheduled during non-production windows, while a failed valve or sensor during a run can cause product loss, container accumulation, cleaning work, and delayed downstream packaging. The distinction matters when comparing machines: lower routine service cost does not necessarily offset frequent unscheduled stops.
A simple maintenance allocation is:
Maintenance cost per period = Planned service labor + spare parts consumed + corrective repair labor + external service + maintenance-related lost contribution
For a new machine without operating history, use a forecast with clearly stated assumptions. Ask for recommended service intervals, wear-part lists, expected cleaning exposure, required spare inventory, and the likely lead time for critical components. The forecast should then be reviewed after actual production data is available rather than retained unchanged for the full asset life.
Cleaning and product loss are process costs
Cleaning-in-place or manual cleaning can be a major expense in beverage filling, especially when flavors, colors, sweeteners, dairy ingredients, pulp, or high-viscosity products require longer flushing or more thorough disassembly. Count the water, cleaning chemicals, heating energy where used, wastewater handling, labor, and lost production window. Product remaining in tanks, manifolds, hoses, pumps, and filling valves should be valued at its material cost unless it is demonstrably recovered for compliant reuse.
Cleaning duration alone does not tell the whole story. A short rinse that leaves residues can lead to quality rejects or a later re-cleaning event. Conversely, a more controlled cleaning sequence may reduce total cost when it shortens restart stabilization and lowers contamination risk. The cost model should therefore connect cleaning with the number of accepted units produced after restart.
Product characteristics change the calculation. Carbonated beverages may require slower filling or more careful pressure control to limit foam. Hot-filled products introduce heating and cooling considerations. Pulp-containing drinks can increase cleaning burden and wear in product-contact paths. Thin, non-carbonated liquids may permit a different throughput profile from viscous syrups even on the same machine frame.
Put a value on downtime without double-counting it
Downtime is often the largest omitted cost, yet it must be handled carefully. If all labor and fixed overhead have already been included in the period total, adding them again for every stopped minute double-counts the expense. The additional downtime value should represent the contribution that could have been earned from saleable output, plus incremental loss such as discarded product or emergency repair charges.
A suitable approach is:
Downtime cost = Lost saleable units × contribution per unit + incremental recovery cost
Lost saleable units should be based on the constrained point in the line. If the filler is faster than the capper, labeler, or packing section, filling-machine downtime does not always equal finished-goods loss. Similarly, downtime during a period with spare capacity may have little immediate contribution impact, although it still reduces flexibility and can create overtime or delayed shipments later. Record the cause code: filler fault, product supply delay, container feed, cap feed, downstream blockage, planned sanitation, or format change. Each cause calls for a different corrective action.
Downstream packaging should remain inside the boundary when it regularly limits filling output. For example, a shrink-sleeve or capsule application unit such as the RS-1 Automatic Capsule Heat Shrink Machine may affect line flow after filling and capping. Its energy, labor, and stoppages should be allocated to the finished-package cost when it is a required stage for that SKU, rather than being treated as unrelated overhead.
Compare alternatives on the same operating scenario
A fair equipment comparison uses the same annual production volume, product mix, package formats, shift schedule, utility tariffs, labor rates, and quality requirements. Comparing one machine at its best-case rated speed with another at a realistic mixed-SKU schedule produces a false advantage. The model should also distinguish between capacity needed for average demand and capacity needed for peak production windows.
Build at least two scenarios. The base scenario should reflect expected routine production. A stress scenario should include frequent changeovers, the most difficult product or container combination, cleaning frequency, and likely downtime conditions. If a machine only achieves its projected unit cost when it runs long batches of one easy-to-fill product, that condition should be visible before approval.
Installation-related operating effects also deserve attention. Long product lines can increase start-up loss and cleaning volume. Inadequate compressed-air capacity can reduce pneumatic performance. Poor drainage, difficult access to valves, or limited space around the filler can extend sanitation and maintenance time. These are not merely installation issues; they alter the recurring cost of every production period.
Keep the model useful after commissioning
The first budget is an estimate. Its value comes from the ability to compare the estimate with actual records and identify why the result changed. Use the same definitions each month for scheduled time, saleable output, labor allocation, reject classification, and downtime causes. A changing formula can create the appearance of improvement or deterioration without any real operational change.
Review cost per saleable container alongside run length, format, product type, reject reason, cleaning duration, and downtime cause. A rising cost per unit may come from lower throughput, higher waste, a maintenance issue, or a deliberate increase in cleaning frequency. Those causes require different responses, and a single blended operating-cost number cannot explain them on its own.
The resulting calculation supports a more disciplined capital decision because it converts equipment performance into a traceable operating assumption. Purchase price remains relevant, but long-term profitability is determined by the accepted output delivered from each scheduled production hour and the recurring resources required to produce it.
Leave A Message
If you are interested in our products and want to know more details, please leave a message here, we will reply you as soon as we can.